The ocean is changing faster than our ability to understand it — this study creates a solution.
Across fisheries, tourism, and offshore development, decisions are being made in environments that are shifting in real time—species move, pressures change, and conditions evolve.
But the systems used to understand these changes haven’t kept up.
Most environmental data are still collected in fragments, analyzed slowly, and published long after decisions are made. By the time insights reach the people who need them, they’re already out of date.
In Fiji, this gap was already being felt. Sharks sit at the center of both ecosystem health and a globally significant tourism industry—one that depends on reliable, repeatable encounters with marine life. And yet, there was no clear, comprehensive picture of where sharks were, how their presence was changing, or whether populations were stable.
The question wasn’t just scientific—it was economic, operational, and strategic: Do sharks need protection? Where? And based on what evidence?
At the time, the data simply didn’t exist to answer that with confidence.
So a different approach was used.
What this study actually did
The Great Fiji Shark Count asked a simple but powerful question: What if the people already in the water every day could help generate the data needed to understand shark populations—and, if structured properly, inform how they are managed?
Rather than relying on infrequent, resource-intensive scientific surveys, the initiative worked with dive operators across the country to record shark sightings during their normal activities. These were not anecdotal observations—they were standardized, repeatable records that included presence, absence, and abundance by species. It also included repeated measures to compare for sensitivity.
Over time, those individual logs accumulated into something far more powerful.
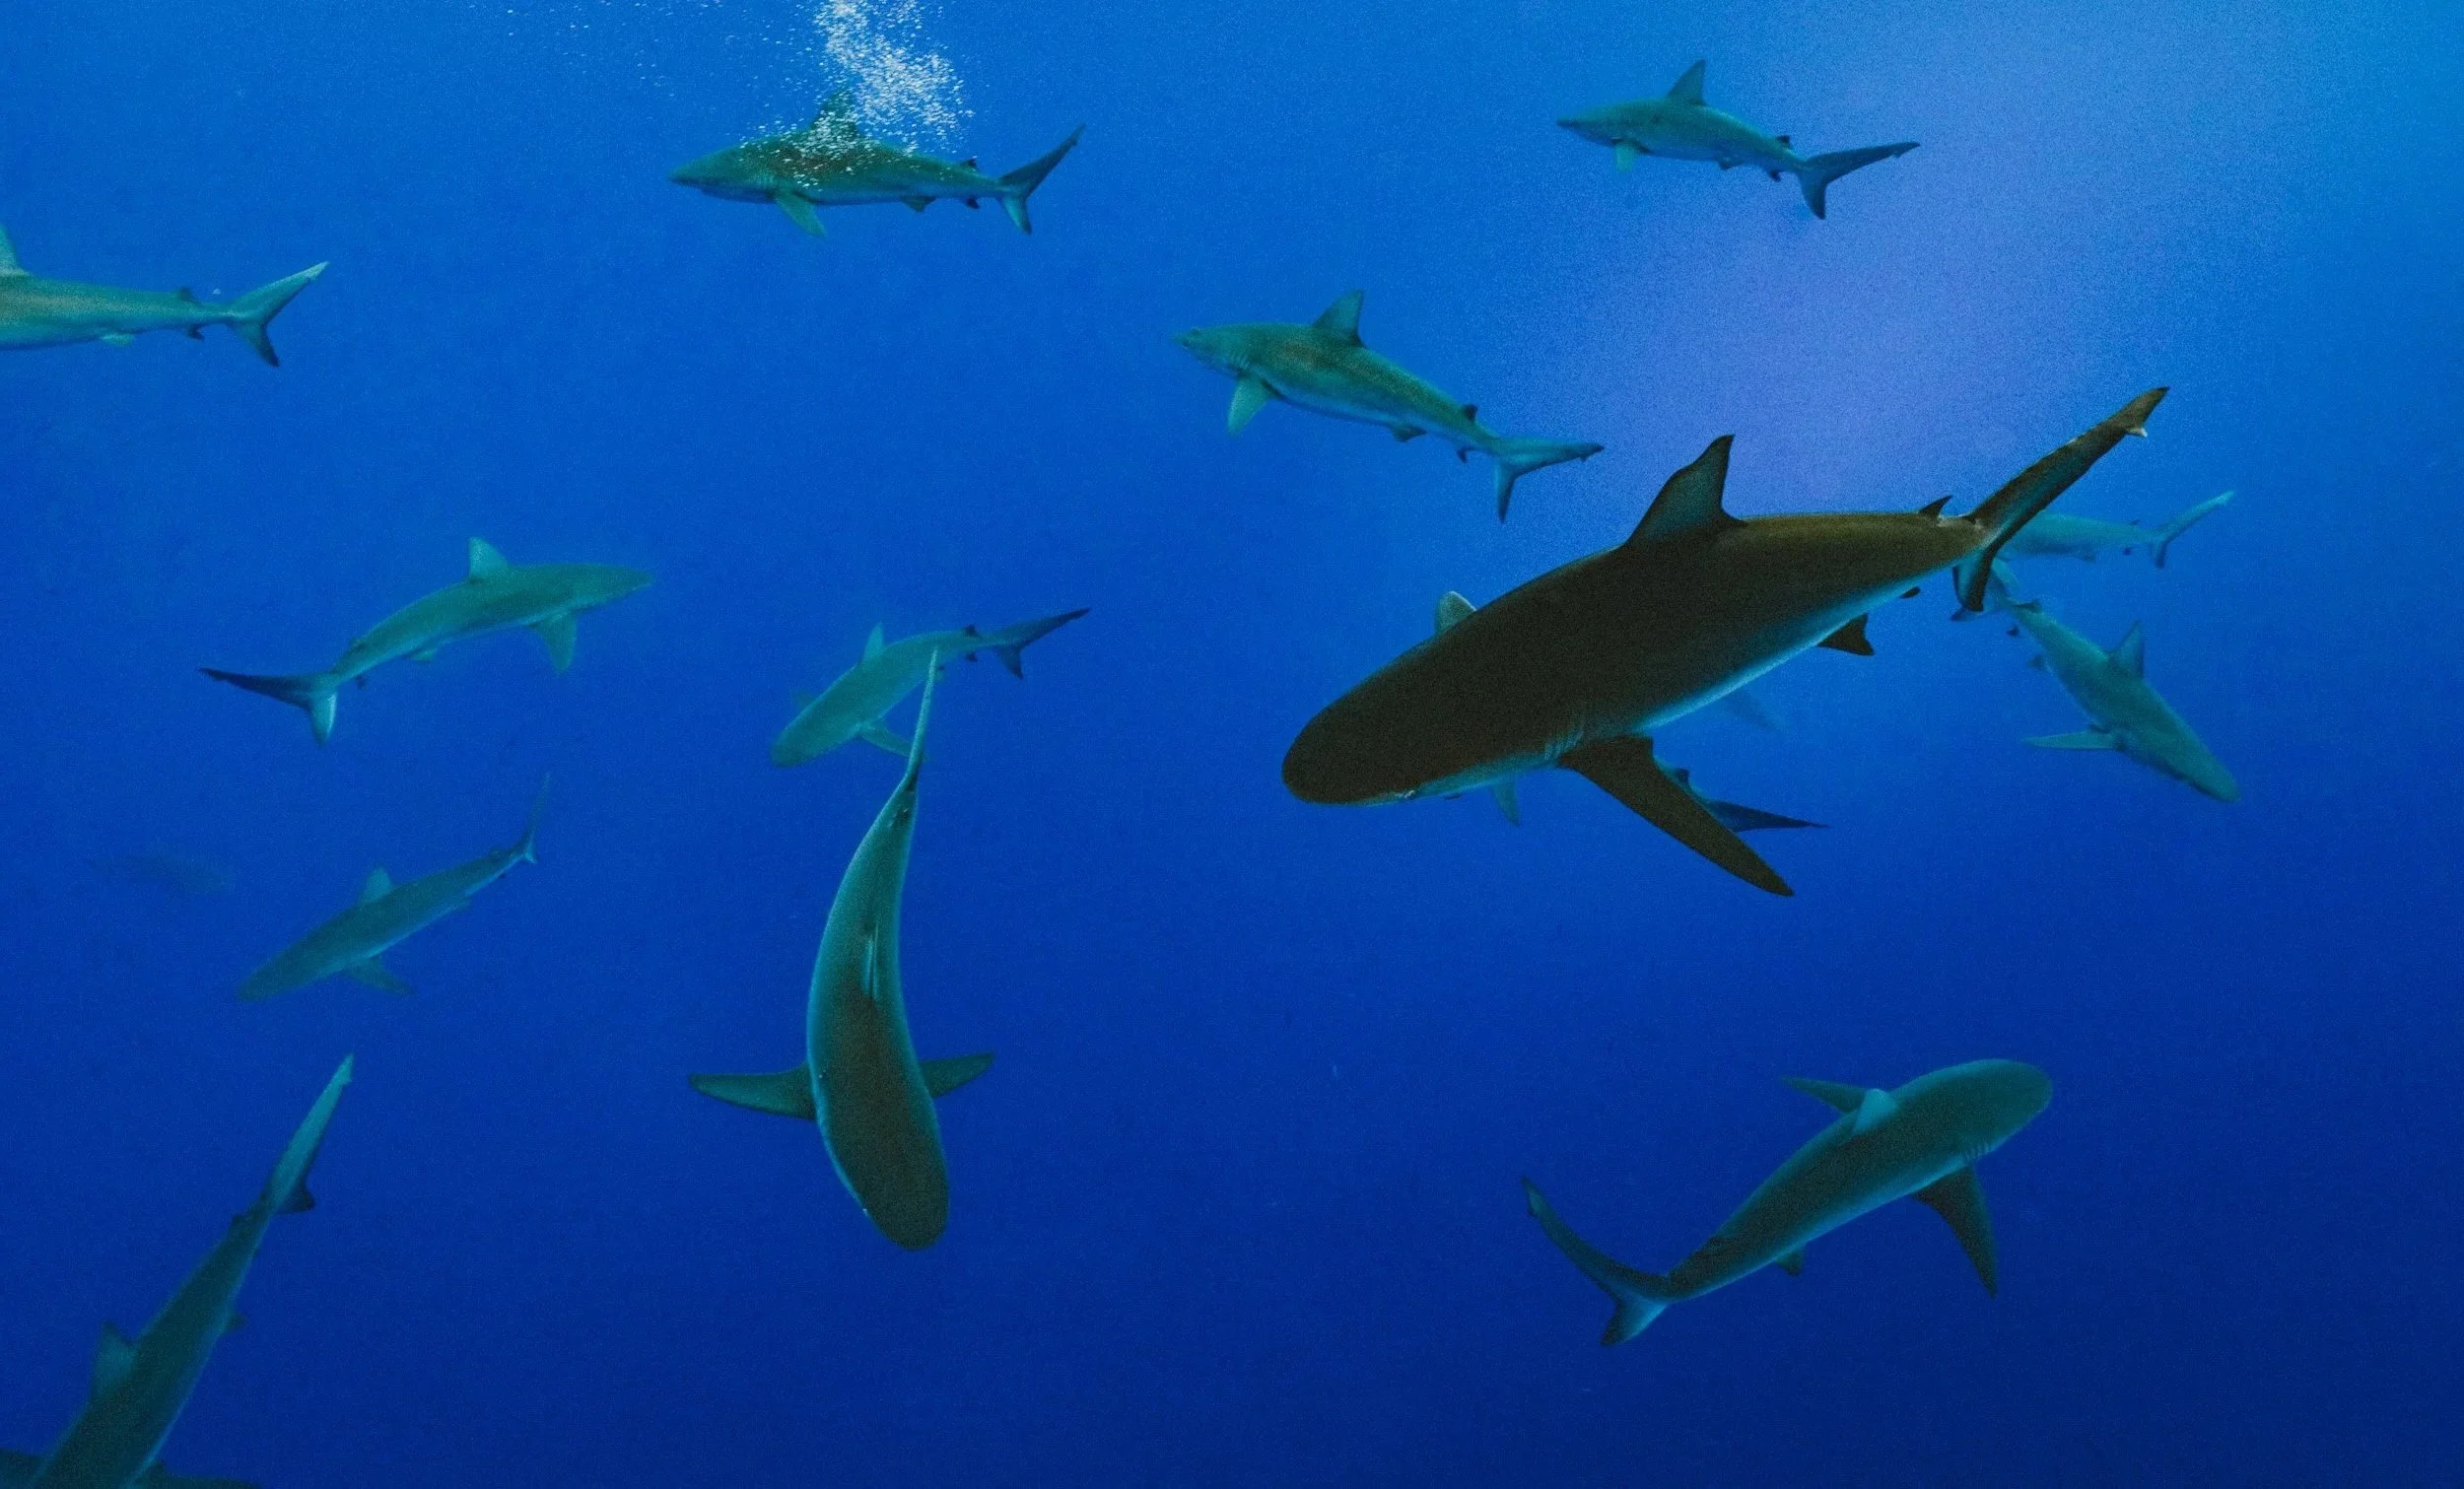
Across 39 dive operators and more than 30,000 dives, over 146,000 observations were recorded, spanning 592 sites and 11 shark species.
What emerged was not just a dataset, but one of the most comprehensive, longitudinal records of shark occurrence ever assembled at a national scale—offering a detailed view of how sharks use space and how that use changes over time.
What the study revealed
The results confirm what many suspected—but had never been able to demonstrate at this scale.
Sharks are not evenly distributed. Some sites consistently support high abundance and diversity, while others rarely host sharks at all. These patterns are not random—they reflect underlying ecological conditions, human pressures, and potentially management effectiveness.
But just as important is what happens over time.
Shark presence shifts. Seasonally. Annually. Across regions. What appears stable in one snapshot may be changing in another. This is where the value of longitudinal data becomes clear: without it, real trends remain hidden.
Different species tell different stories. Some are widely distributed; others are highly localized. One of the more unexpected findings was a shift in the distribution of Whitetip Reef Shark, the most commonly observed species, which declined in eastern sites while increasing in western ones. The drivers of this pattern remain unclear—but the signal itself is critical.
Perhaps most importantly, the study makes visible something often discussed but rarely quantified: the direct link between ecological presence and economic activity.
Sites with consistent shark presence are often the same sites that underpin Fiji’s dive tourism industry. These animals are not just part of the ecosystem—they are part of the country’s natural capital.
Why this matters for real-world decisions
For those making decisions about ocean use—whether approving developments, designing monitoring programs, setting policy, or investing in marine industries—this changes what’s possible.
It shows that high-resolution baseline data can be generated at scale, without waiting years or relying solely on centralized scientific campaigns. It demonstrates that monitoring can be continuous, not episodic. And it provides the kind of spatial and temporal detail needed to actually reduce uncertainty.
That matters.
It means environmental assessments can be grounded in real patterns, not assumptions. Sensitive areas can be identified earlier. Management strategies can be evaluated against observed trends. And operations—whether in tourism, fisheries, or offshore energy—can better align with how ecosystems actually function.
It also opens the door to something broader: shared ownership of data and insight, where industry, scientists, and communities contribute to—and benefit from—a common understanding of the ocean.
The gap no one talks about
And yet, even with a dataset of this scale, a familiar limitation remains.
The challenge is no longer whether we can collect enough data.
It’s whether we can turn those data into usable insight—fast enough to matter.
In this case, as with many large-scale studies, the data were manually processed and analyzed. The outputs, while robust, followed a traditional path: collection, aggregation, analysis, publication.
Time passes at each step.
And in a rapidly changing ocean, that delay matters.
This is where most systems still break—not in data generation, but in timeliness, integration, and accessibility. Data exist, but they are not yet moving at the speed of decision-making.
What changes now
The Great Fiji Shark Count demonstrates that participatory, distributed monitoring works—and that stakeholders are not only capable, but motivated, to contribute to science and management.
The next step is removing the lag between observation and insight.
Instead of data being written into logbooks and processed later, they can now be recorded, structured, and analyzed in real time. Patterns can update continuously. Contributors can see the results of their efforts as they happen. Decision-makers can access current, evolving intelligence—not static reports.
This is the shift from periodic reporting to live, adaptive knowledge systems.
Platforms like eOceans were built directly from these lessons—designed to ingest, process, and analyze observations as they are collected, across species, activities, and geographies. What once took years can now happen continuously.
And importantly, contributors retain ownership of their data—choosing how and where it is shared—supporting data democracy and self-determination alongside scientific advancement.
Frequently asked questions
How are shark populations monitored at large scales? By combining structured scientific methods with repeated observations from people regularly in the water—such as dive operators—it becomes possible to build large, high-resolution datasets across many locations and time periods.
Why is including absences (no sightings) important? Absence data are critical for understanding true patterns of distribution and effort. Knowing where sharks are not observed is just as important as knowing where they are.
Can community-driven data support real management decisions? Yes. When collected consistently and at scale, participatory data can match patterns observed in more traditional methods and provide additional spatial and temporal resolution.
How does this help environmental impact assessments and approvals? It strengthens baseline datasets, reduces uncertainty, and helps identify sensitive or high-value areas earlier in the decision-making process.
Why are traditional monitoring systems often insufficient? They are typically expensive, limited in scope, and slow to produce results—making it difficult to keep pace with environmental change.
What are the added benefits of participatory science? Beyond data, these programs build trust, increase ocean literacy, create feedback loops between stakeholders and scientists, and support broader conservation and sustainability goals.
Can this model be applied globally? Yes. Any region with regular ocean users—tourism operators, fishers, researchers—can adopt this approach to generate scalable, decision-relevant data.
Final thought
The Great Fiji Shark Count didn’t just map sharks. It demonstrated that when communities, industry, and science come together—with the right structure—entirely new ways of understanding and managing the ocean become possible.
And more importantly: it showed that the future of ocean data is not just bigger—it’s faster, shared, and continuously evolving.
Read the full study
Published in Pacific Conservation Biology: Community-driven shark monitoring for informed decision making: a case study from Fiji (Ward-Paige et al., 2023)