Case study: Monitoring Marine Protected Area Performance at Scale
How Ocean Science Analytics integrated historical records with continuous field observations to evaluate California's La Jolla North Marine Protected Area
>90% reduction in the cost of delivering data-based MPA performance assessments, with faster deployment, automated analysis, and continuous evidence generation
Executive Summary
Marine Protected Areas (MPAs) represent one of the world's largest conservation investments, with billions committed through national and international initiatives such as 30×30. Demonstrating whether these protected areas are achieving their ecological and social objectives requires long-term, repeatable monitoring. However, many monitoring programs remain fragmented across multiple datasets, software tools, organizations, and reporting workflows.
Ocean Science Analytics (OSA) developed a monitoring program for the La Jolla North Marine Protected Area in California using the eOceans platform to integrate historical biodiversity records with continuous field observations collected by trained local observers.
During its first year, the program generated:
247 Surveys completed
245,908 Animals recorded
6,445 Human activities documented
138 Pollution observations reported
4 Historical datasets integrated from OBIS (1976–2021)
The resulting dataset simultaneously monitored biodiversity, human use (social values, illegal activities), environmental threats, and survey effort within a single analytical workflow, providing a more complete picture of MPA performance than historical biodiversity records alone.
Operational Outcomes
The project demonstrated measurable operational efficiencies compared with a traditional custom-built monitoring programs:
Deployment time: 2 hours instead of an estimated 6 months to design and build a custom data management system
Staffing: One part-time scientist managed a workflow typically requiring multiple organizations, systems, and specialist expertise
Analysis time: Approximately 80% reduction in data processing, analysis, and reporting effort
Software consolidation: One integrated workflow replaced 8 typical tools (R, Excel, Google Docs, Messenger, GIS software, paper data sheets, handheld GPS units, and manual reporting)
Custom development: None required. No custom databases, R scripts, R Shiny applications, or GIS workflows were developed or maintained
Historical data integration: Four historical datasets were standardized, imported, and incorporated to provide baseline perspectives
Reporting: Dashboards and reports updated continuously as new observations were submitted, replacing annual or decadal manual reporting
Cost savings: Reduced the cost of bringing together and analyzing biological, social, threat, and environmental data for an MPA performance assessment from a typical specialist-led process costing $500K–$1M to approximately $3K/year using eOceans — a >90% reduction in assessment delivery costs. The same workflow can be updated continuously as new data become available, rather than requiring a new analysis every decade.
Traditional MPA assessments require teams of specialists to identify available datasets, obtain and standardize information from multiple sources, conduct analyses, develop indicators, and prepare assessment reports for review and publication. eOceans compresses this process by providing the underlying data infrastructure, analytical workflows, and reporting tools in one system—allowing teams to focus their expertise on interpretation and management decisions rather than repeatedly rebuilding the assessment process.
Background
California's Marine Protected Area network was established to conserve biodiversity while supporting sustainable human use of coastal ecosystems. Evaluating whether these objectives are being achieved requires consistent monitoring over long time periods.
Historically, monitoring has often been constrained by fragmented datasets, disconnected workflows, and separate reporting systems for biodiversity, human activities, pollution, and environmental conditions. These limitations make it difficult to evaluate ecological trends alongside the social and anthropogenic factors that influence management outcomes.
Ocean Science Analytics sought to develop a monitoring framework capable of integrating these dimensions into a single, continuously updated system.
Technical Objectives
The monitoring program was designed to:
integrate historical and contemporary datasets
standardize observations from multiple survey types
retain both species observations and survey effort, including non-detections
monitor biodiversity, human activities, and environmental threats simultaneously
automate data validation, quality control, analysis, and reporting
support collaboration among field teams without requiring custom software development
Methods
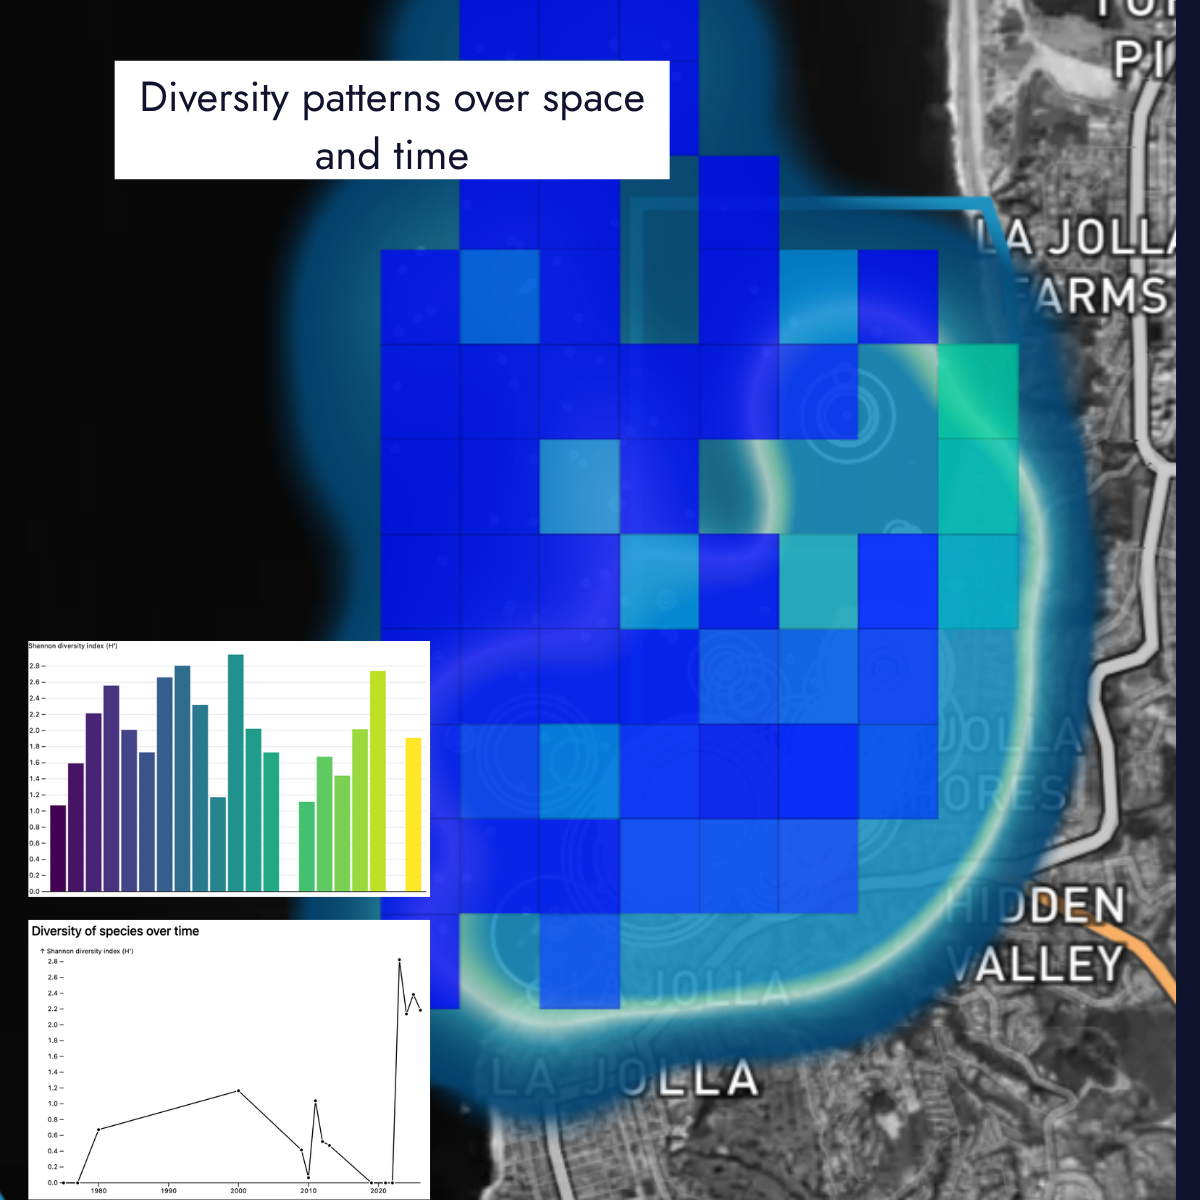
Historical Data: Historical biodiversity records from 1976–2021 were obtained from four datasets within the Ocean Biodiversity Information System (OBIS). These datasets included scuba, shore-based, aerial, and vessel surveys.
The datasets were standardized and imported into the platform to establish historical baselines.
Contemporary Monitoring: The study area was defined using geofenced Marine Protected Area boundaries and predefined monitoring locations.
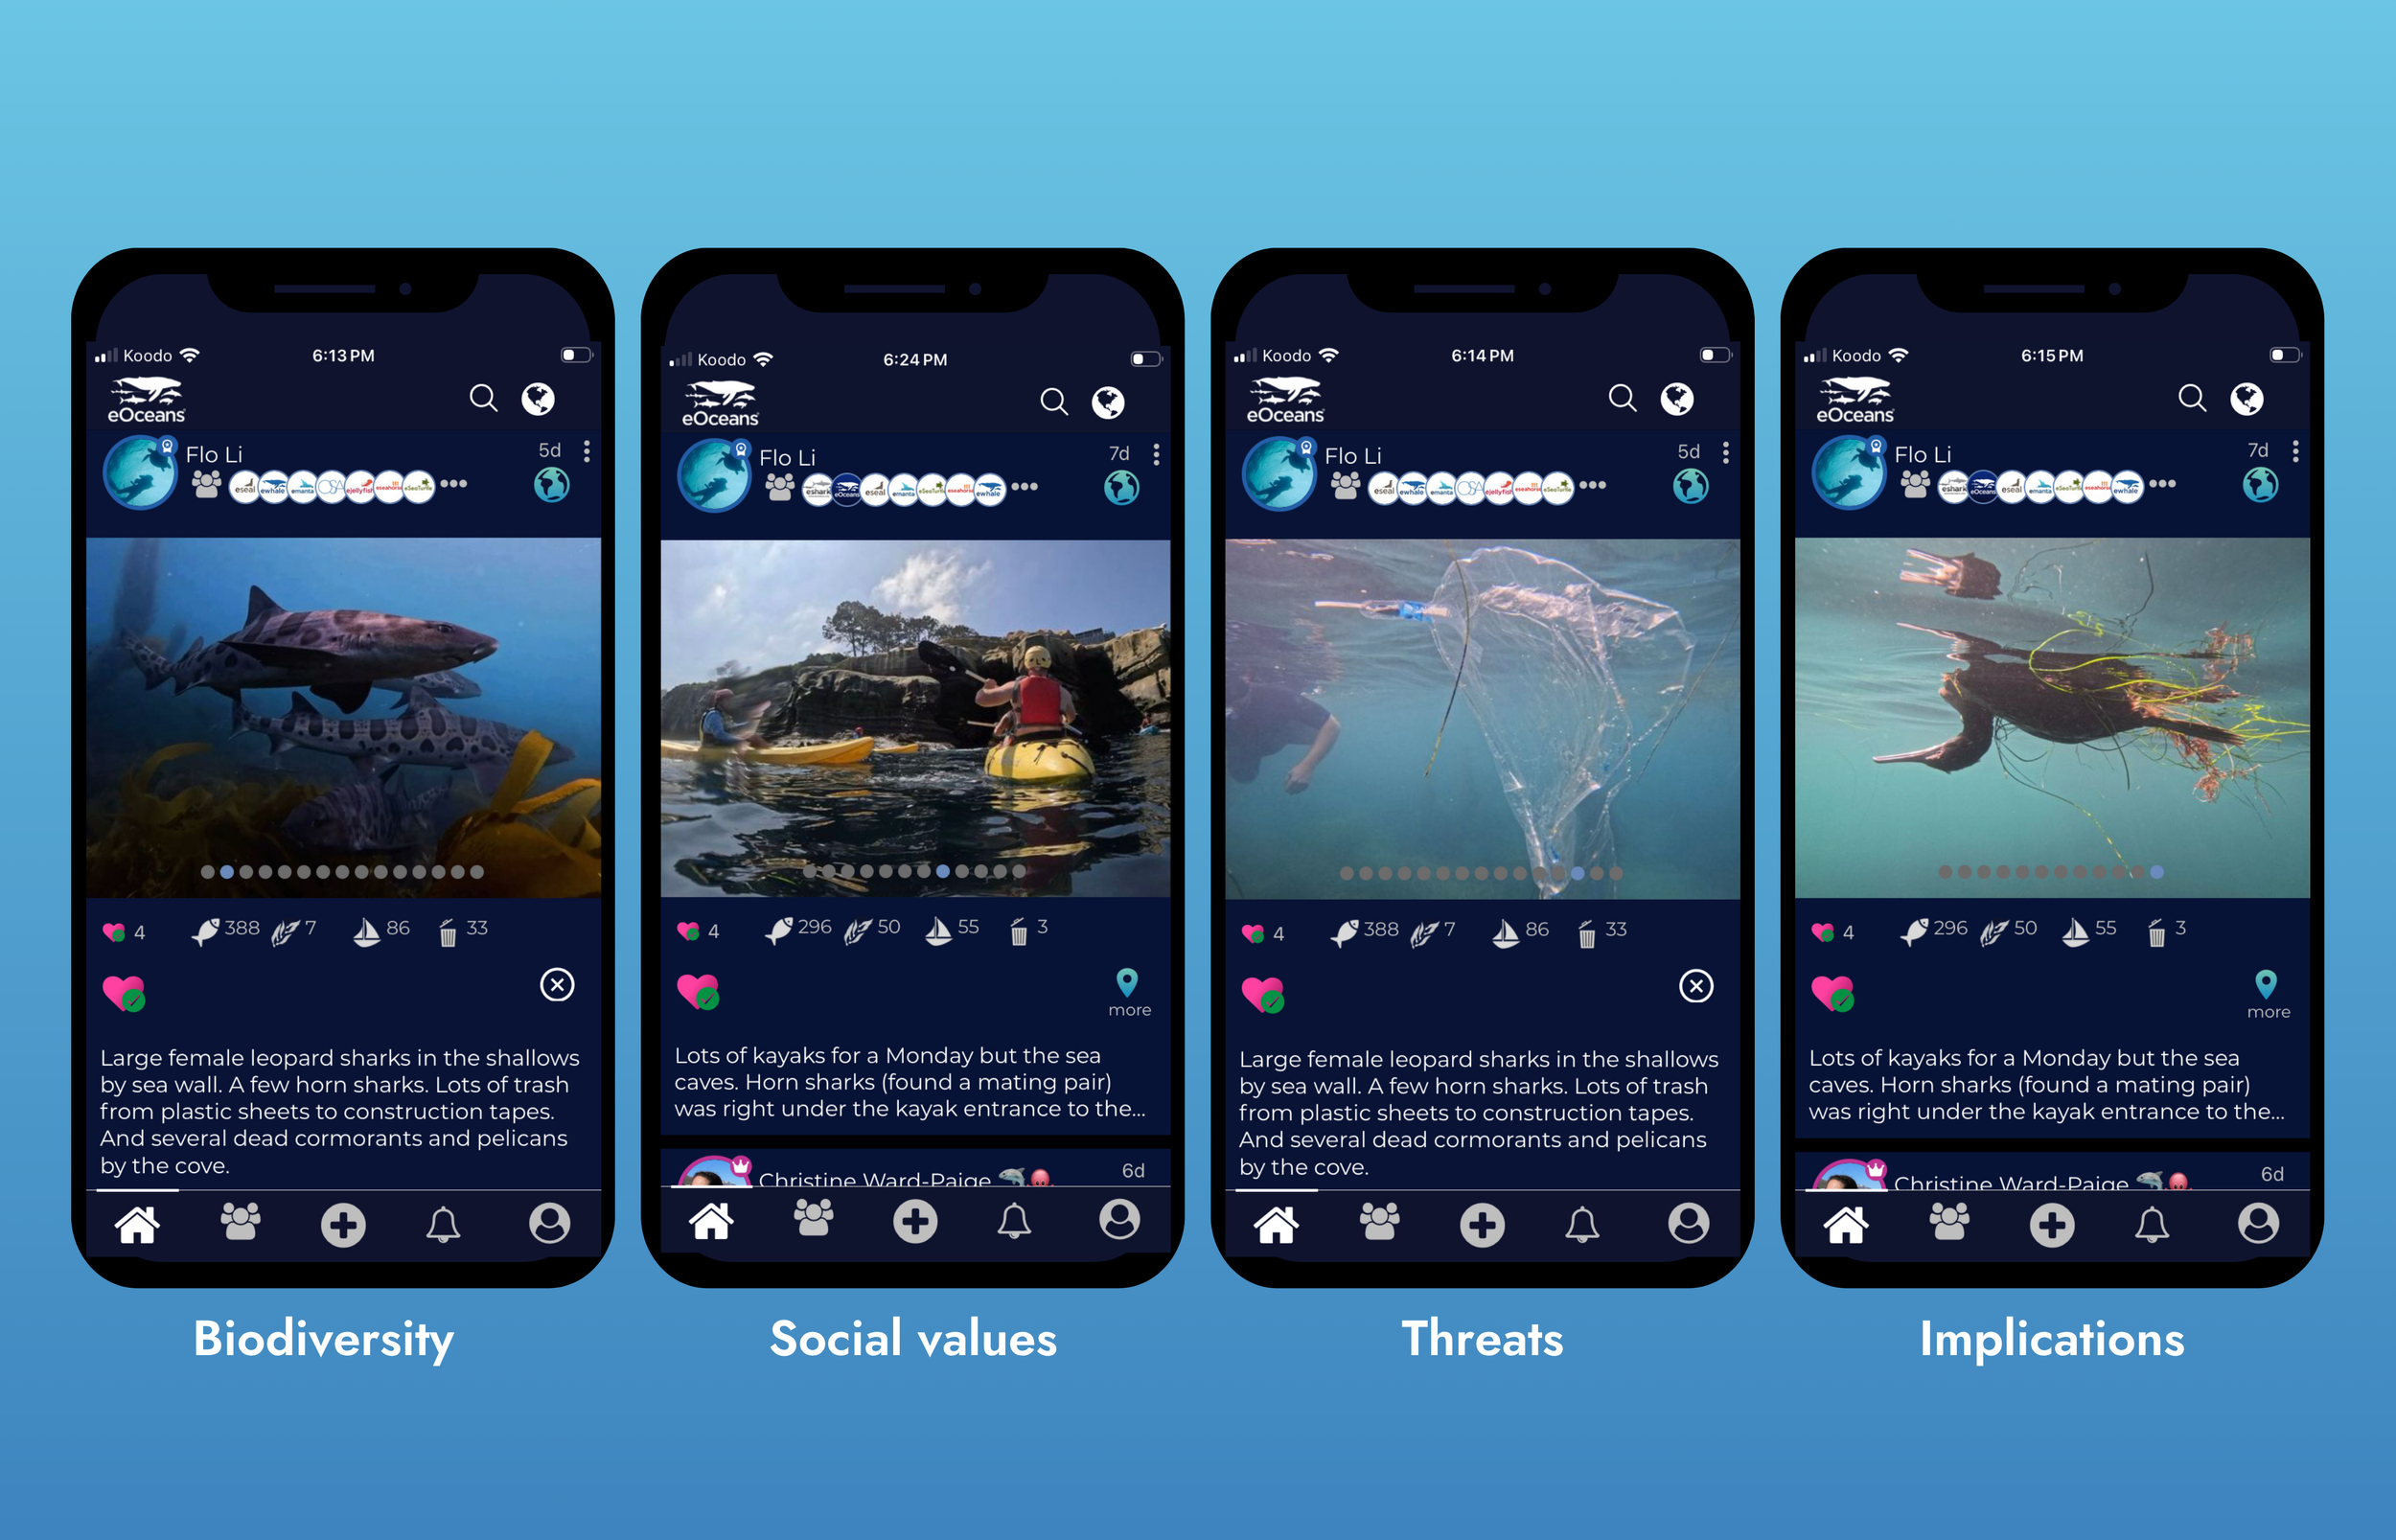
Data collectors: Qualified observers conducting routine scuba diving and snorkelling surveys collected observations using the eOceans mobile application. Students were also trained to capture human use and biodiversity data from stationary beach and underwater cameras. Temperature sensors have also recently been deployed.
Each survey recorded:
GPS location
date and time
survey effort
environmental conditions
species observations, including abundance, behaviour, health
human activities, abundance of each time
pollution and environmental threats: abundance of each type
supporting photographs, field notes
Unlike traditional species recording systems, survey effort and zero observations were automatically retained, allowing changes in occurrence and abundance to be evaluated through time.
Results
Monitoring Effort
Within one year, the program completed:
247 surveys
245,908 animals recorded
6,445 human activities
138 pollution observations
The monitoring effort approximately doubled the number of surveys previously available for the site while substantially expanding the scope of information collected beyond biodiversity alone.
Biodiversity
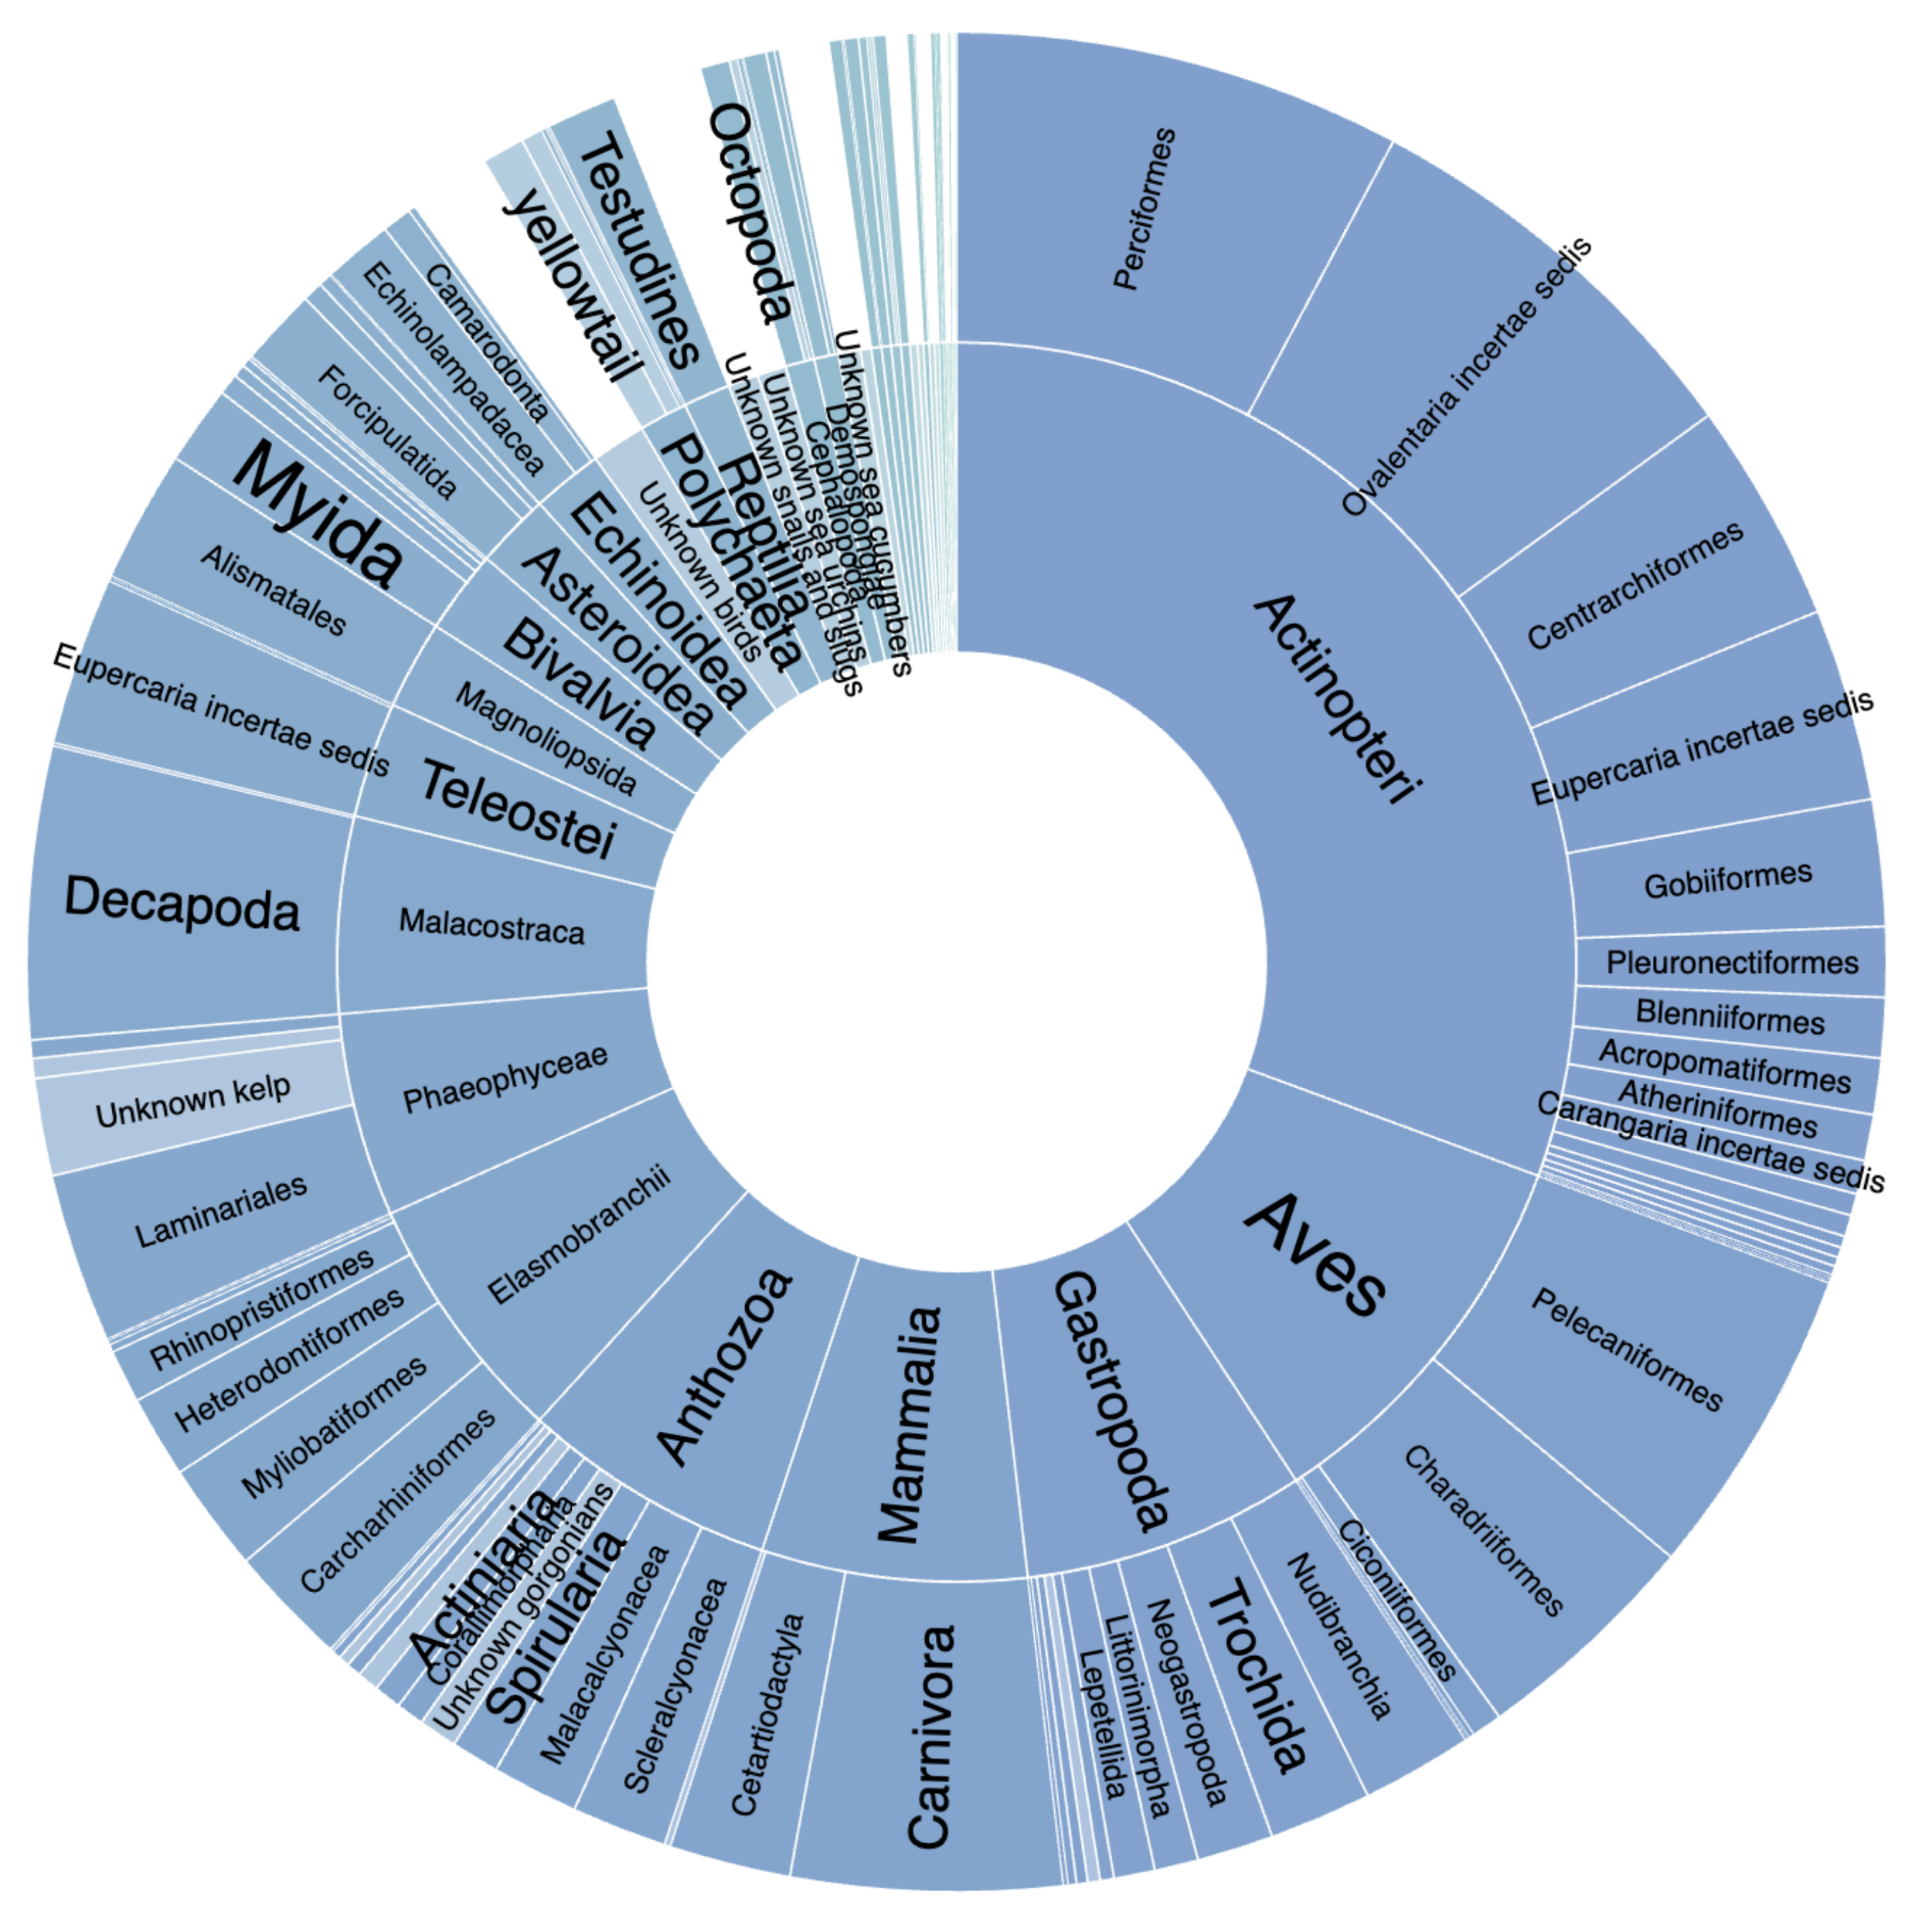
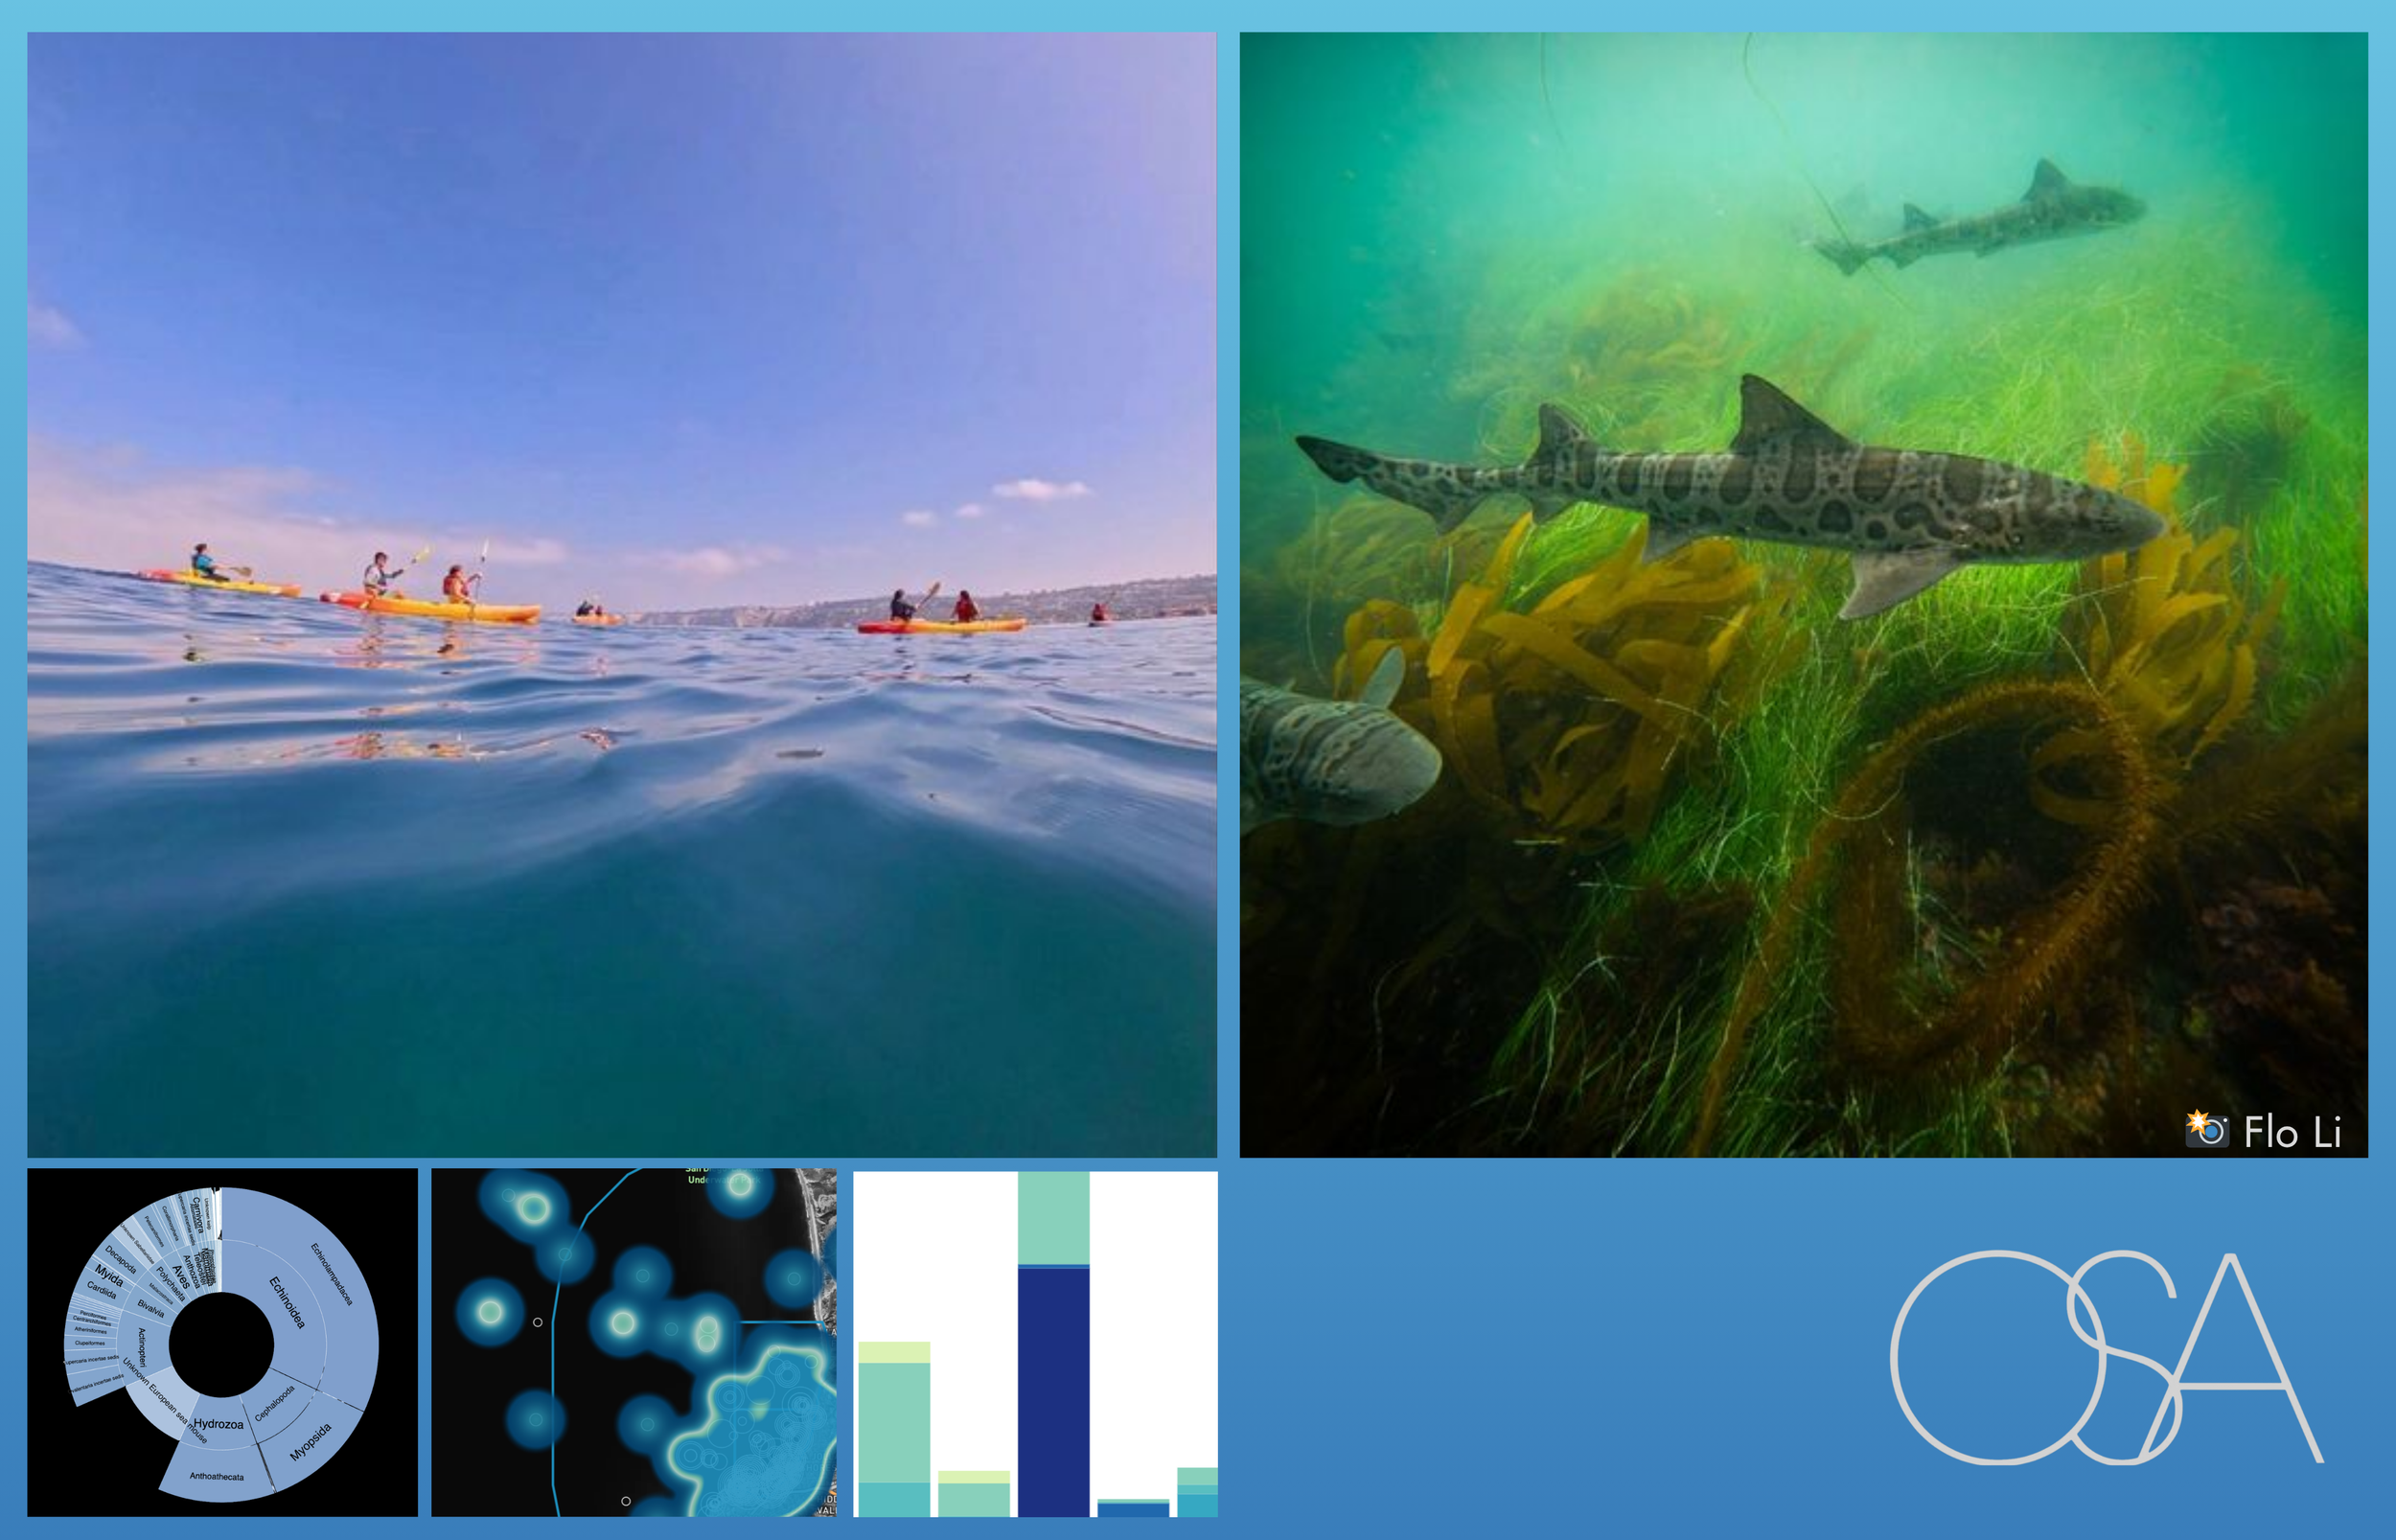
Observers documented a diverse range of marine life, including:
leopard sharks
juvenile Mola mola
California sea lions
squid spawning aggregations
sea turtles
Each observation included abundance, behaviour, and health information, enabling temporal and spatial analyses of biodiversity patterns.
Human Use
The project documented recreational use alongside ecological observations, including:
scuba diving
snorkelling
surfing
kayaking
swimming
walking
Collecting these observations alongside biodiversity data provided a more complete understanding of the social value of the protected area while supporting assessments of compliance and visitor use.
Environmental Threats
Observers recorded:
abandoned fishing gear
ghost nets
ropes
plastic pollution
wildlife entanglements
These observations identified locations where targeted education, clean-up activities, or management interventions could reduce future impacts.
Discussion
Historical biodiversity datasets provided valuable baseline information but contained relatively sparse observations collected over several decades. They also lacked information on recreational use, compliance, pollution, and other anthropogenic pressures.
By combining historical records with continuously updated field observations, the project produced a more comprehensive assessment of Marine Protected Area performance.
Importantly, biodiversity, human activities, environmental threats, and environmental conditions were collected through a single standardized workflow rather than separate monitoring programs. Data validation, quality control, visualization, and reporting occurred automatically as observations were submitted, substantially reducing manual analytical effort.
The approach also retained survey effort and non-detections, improving the ability to analyse trends through space and time.
Scalability

The same monitoring framework can be applied across California's network of 124 Marine Protected Areas, and globally, without redesigning databases, analytical workflows, or reporting systems.
Because projects remain independently managed while sharing a common data model, regional analyses can integrate biodiversity, fisheries, pollution, endangered species, habitat condition, and other monitoring programs into comparable indicators across multiple sites.
This provides a practical framework for evaluating Marine Protected Area performance at site, network, and regional scales while reducing the technical effort required to deploy and maintain long-term monitoring programs.