
Benefits
80%+ Less Data Science Work
Insights Delivered on Time
Track everything, everywhere
Big or small, local or global—use any data, include any team, engage any collaborator.
1 billion+ variable combinations—
All metrics in one place
From species and ecosystems to human activities, policies, and markets—eOceans can help you track it all.

Backed by experts—
Credibility, auditable
Built by PhD scientists with expertise in socio-ecological monitoring, environmental science, and policy, eOceans empowers your team to do more—amplifying impact and capacity by handling cumbersome data tasks so your experts can focus on work that matters.

Opportunities unlocked—
Act on insights, drive opportunity
With on-demand updates, eOceans reveals emerging opportunities and threats—so you and your stakeholders can move faster and make smarter decisions, actions, and investments.

Data used, without delays—
Mobilize data, on demand
Magic Uploads™ turns your existing data into instant insights—helping you act faster, demonstrate impact, and build trust. Clean datasets can also be downloaded for maximum use and efficiency.

Scale—
Collaborate locally, globally
With eOceans, it's easy to link efforts across projects, teams, regions, and scales. The Ocean Ledger™ and Global Biodiversity Ledger™ are built right in the app to make it effortless to set shared goals and track success.

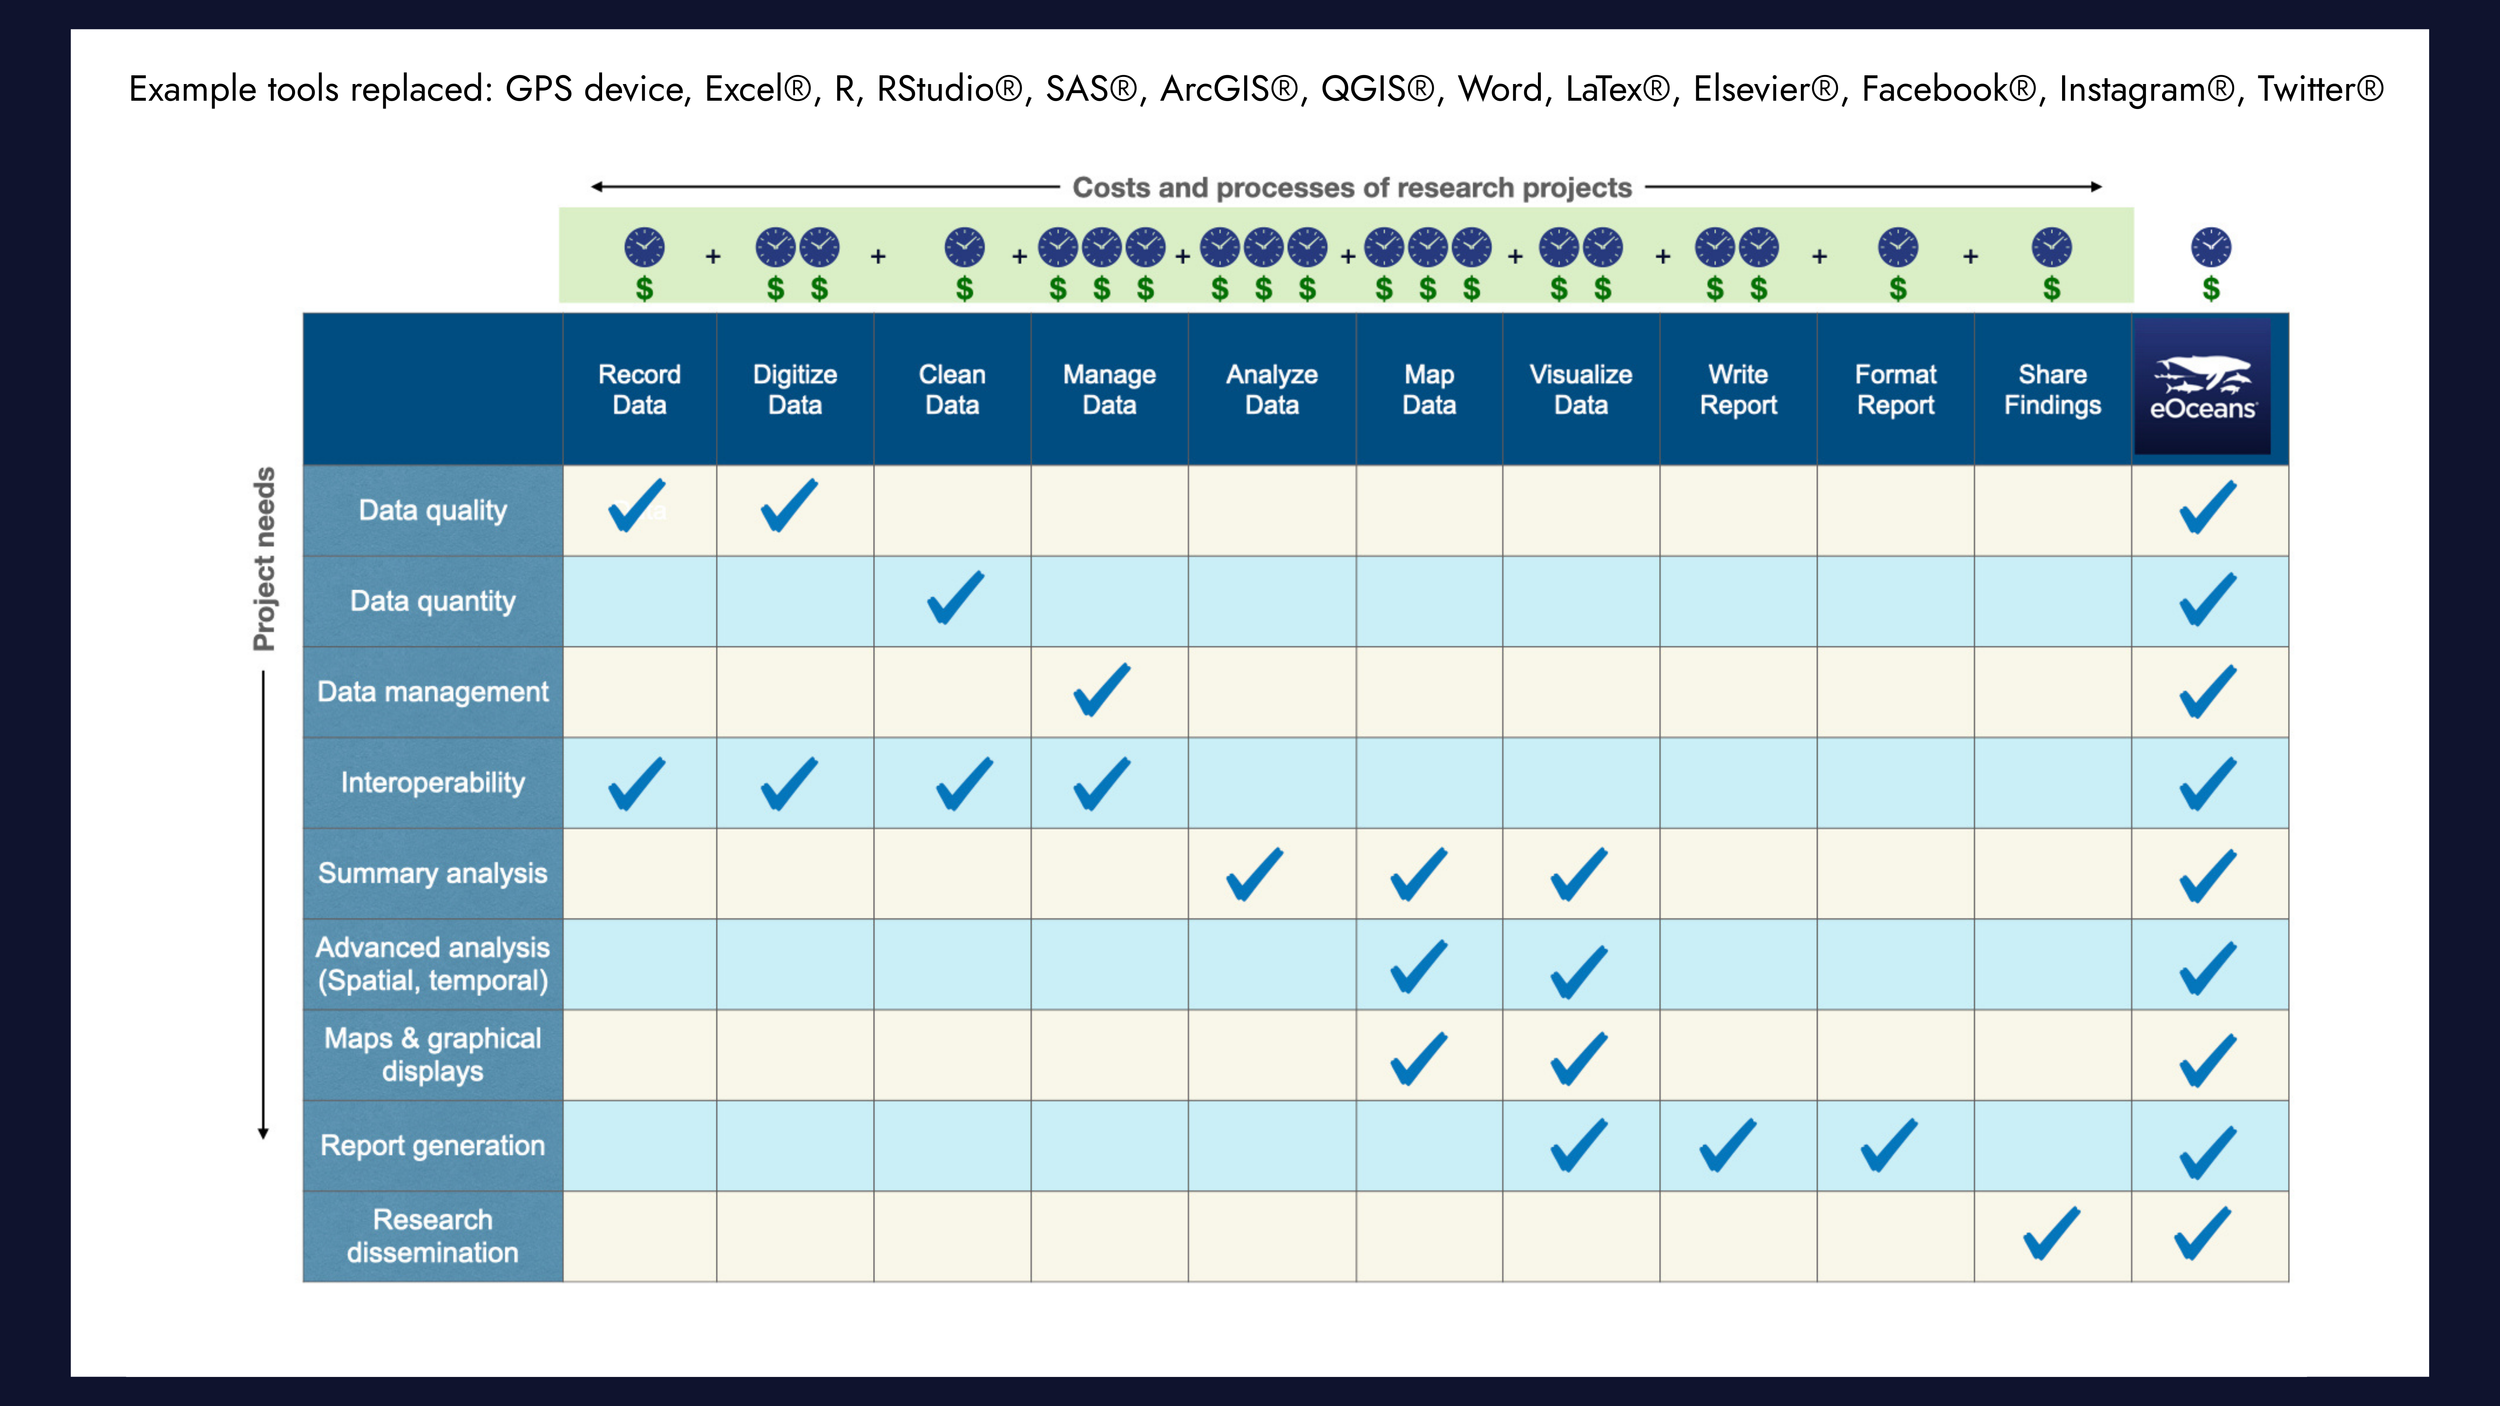
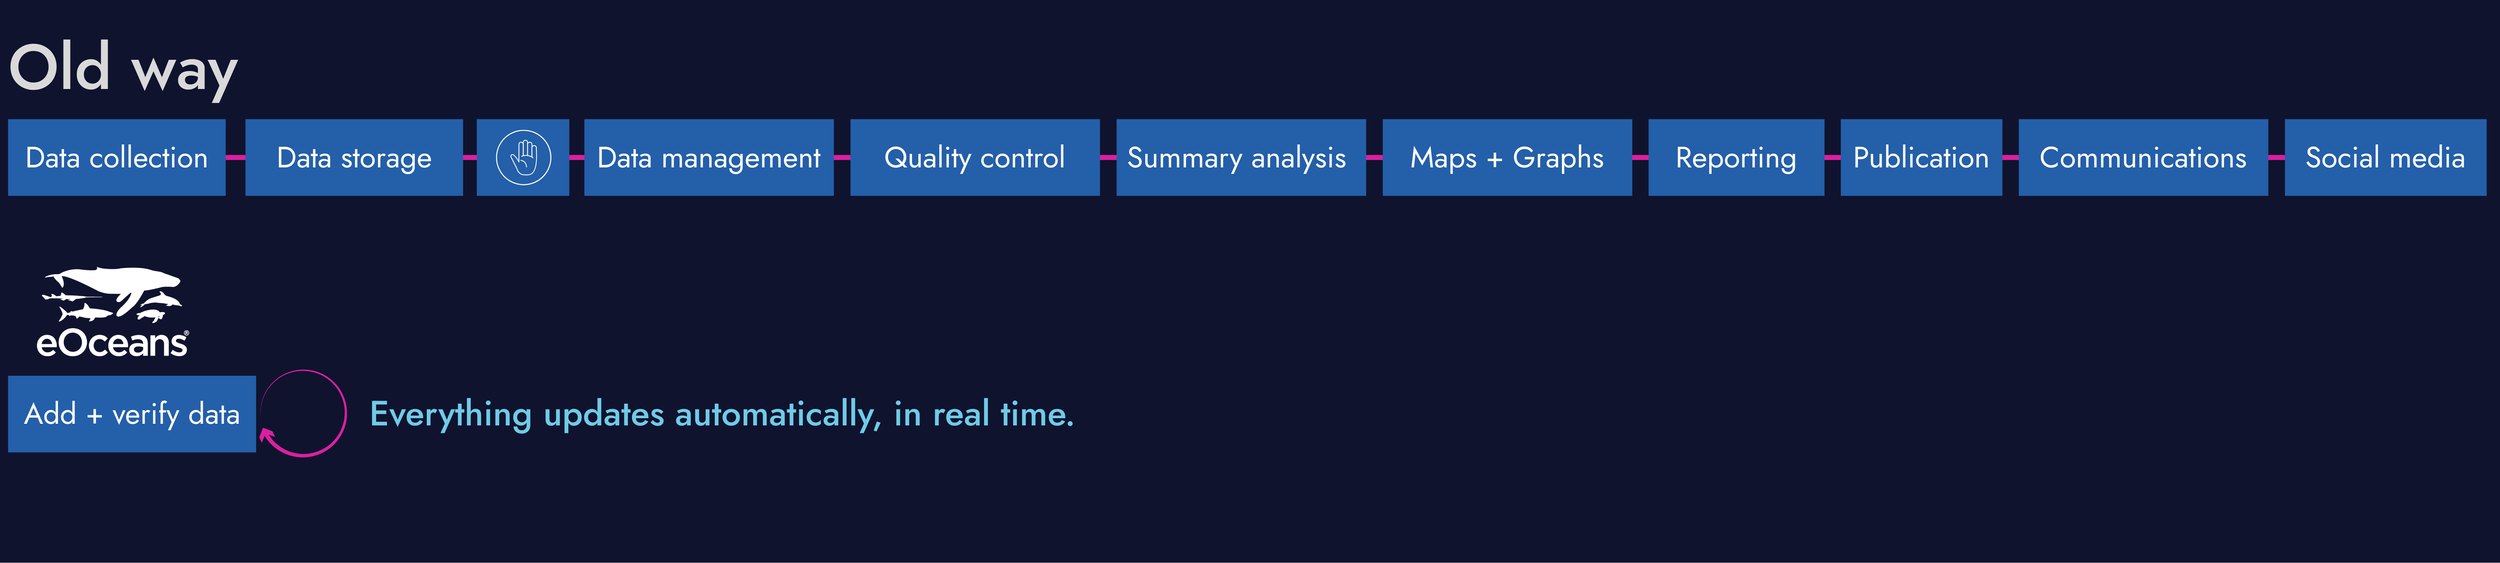
Old, manual tools are insufficient for today’s fast changing world.
-
![A person wearing a black and pink watch writing notes on a notepad, with a partially visible paper on the right side.]()
Paper logsheets?
Messy handwriting in the field, then hours spent re-entering data into spreadsheets—doubling the time and risk of mistakes.
-
![A MacBook Pro on a desk with a coding program open on the screen, and a closed plant book along with some pens and a folded cloth on the left side.]()
R and GIS?
Using R and GIS can easily eat up hundreds to thousands of hours.
-
![Close-up of a laptop keyboard and a portable external hard drive on a light gray surface.]()
Data to be used 'later'?
Data analysis reveals what’s happening and what’s needed—but most data goes unused, underused, or delayed. That’s wasted effort, costing time, money, credibility, and smarter decisions.
-
![Person holding a smartphone with a blank white screen outdoors]()
Open Acces 'Free' apps?
Nothing is “free.” Who owns data and who can access it matters. All risks must be disclosed and mitigated in research. Some communities — including tourism groups, fisheries, and First Nations — have called for bans on open-access nature-logging apps after harvesters used them to locate medicinal plants and animals. The open-access model must be used with care.
-
![People working on computers in an office, one person focused on coding on a monitor.]()
Consultants?
If you don’t have in-house data science experts, expect to spend $60,000–$150,000+ per project—and still start from scratch next time. Efficiency is key.
-
![Two women working at a desk, one with short gray hair pointing at a computer monitor, the other with dark hair looking at the screen, in an office with a colorful poster on the wall.]()
In-house data science?
Just one data scientist can take 8 months to execute even a small data project—at $100/hour, that’s $140,000. Shouldn’t their time be spent on important tasks, not on basics like data cleaning and exploratory analysis?
-
![Desk phone on a black office desk with computer monitors in the background.]()
Phone hotlines?
Many organizations still use phone hotlines for public reports—animals, injured animals, pollution, illegal activities, invasive species, and more—but the experience is frustrating, leading to apathy, underused data, and growing conflict.
-
![]()
Guessing, without data?
Decision making—without analysed data—means you are left guessing. What’s the cost of getting it wrong?


Everything you need, all in one place.
